Starter bundle
2 to 4 weeks, fixed-fee. Written quote inside 48 hours of the discovery call.
← All toolkits·The Numbers Toolkit
The numbers, owned, not rented
The numbers you actually watch, the cash you actually have, and what a job actually costs. Modular, owned, themed to your business.
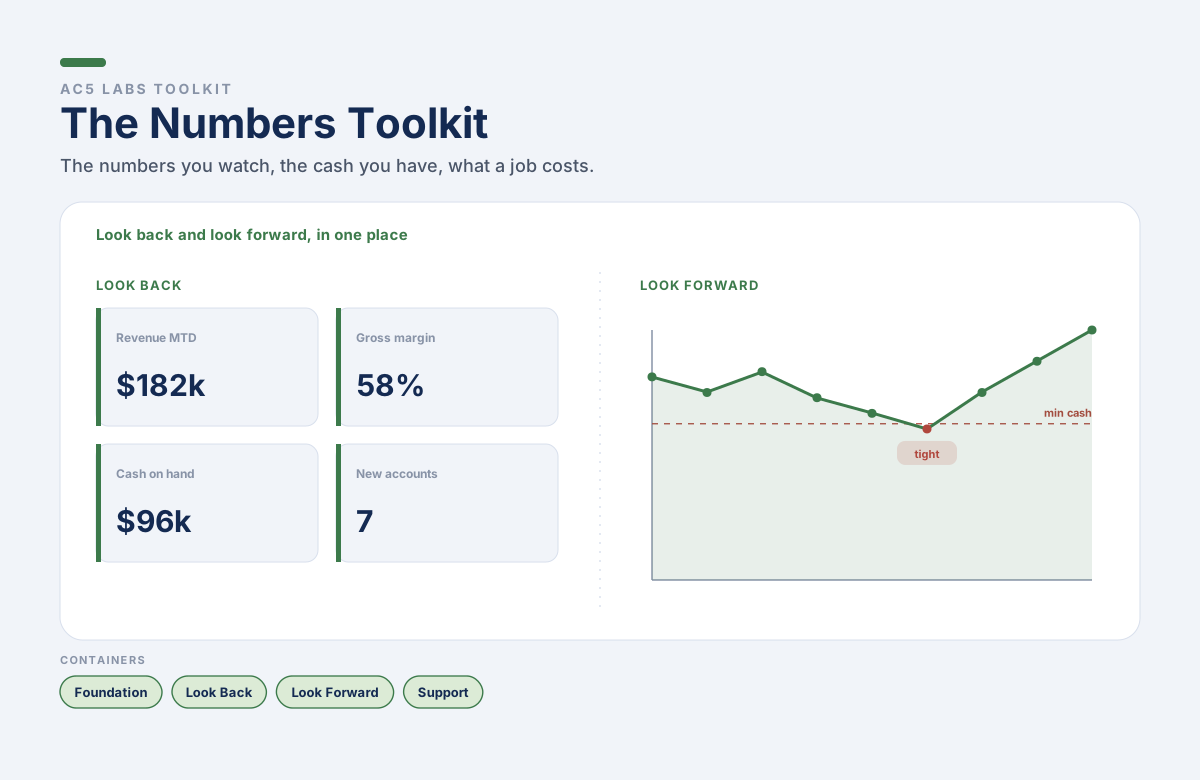
Both halves of the financial picture in one owned toolkit: looking back at what happened, and looking forward at what is coming. Eight containers across Foundation, Look Back, Look Forward, and Support. Pick the containers that fit; we configure the build and hand over the source at the end.
What this is, what this is not
The toolkit reports what happened and forecasts what is coming. It is not your accounting system and it does not do your books; it reads from the data you already keep and turns it into a dashboard, a report, a budget, and a price. It replaces the Friday-morning spreadsheet ritual, the three days of monthly copy-paste, and the per-dashboard analytics subscriptions you pay for now.
This is
This is NOT
The containers
Foundation is always on. The rest are picked in the configurator. Each container is a working module of the toolkit, themed to your business, built into your install.
Tier · Foundation
Authentication, roles and permissions, audit log, encryption, automated backups, export your own data.
Your logo, colors, and fonts on every screen.
Tier · Look Back
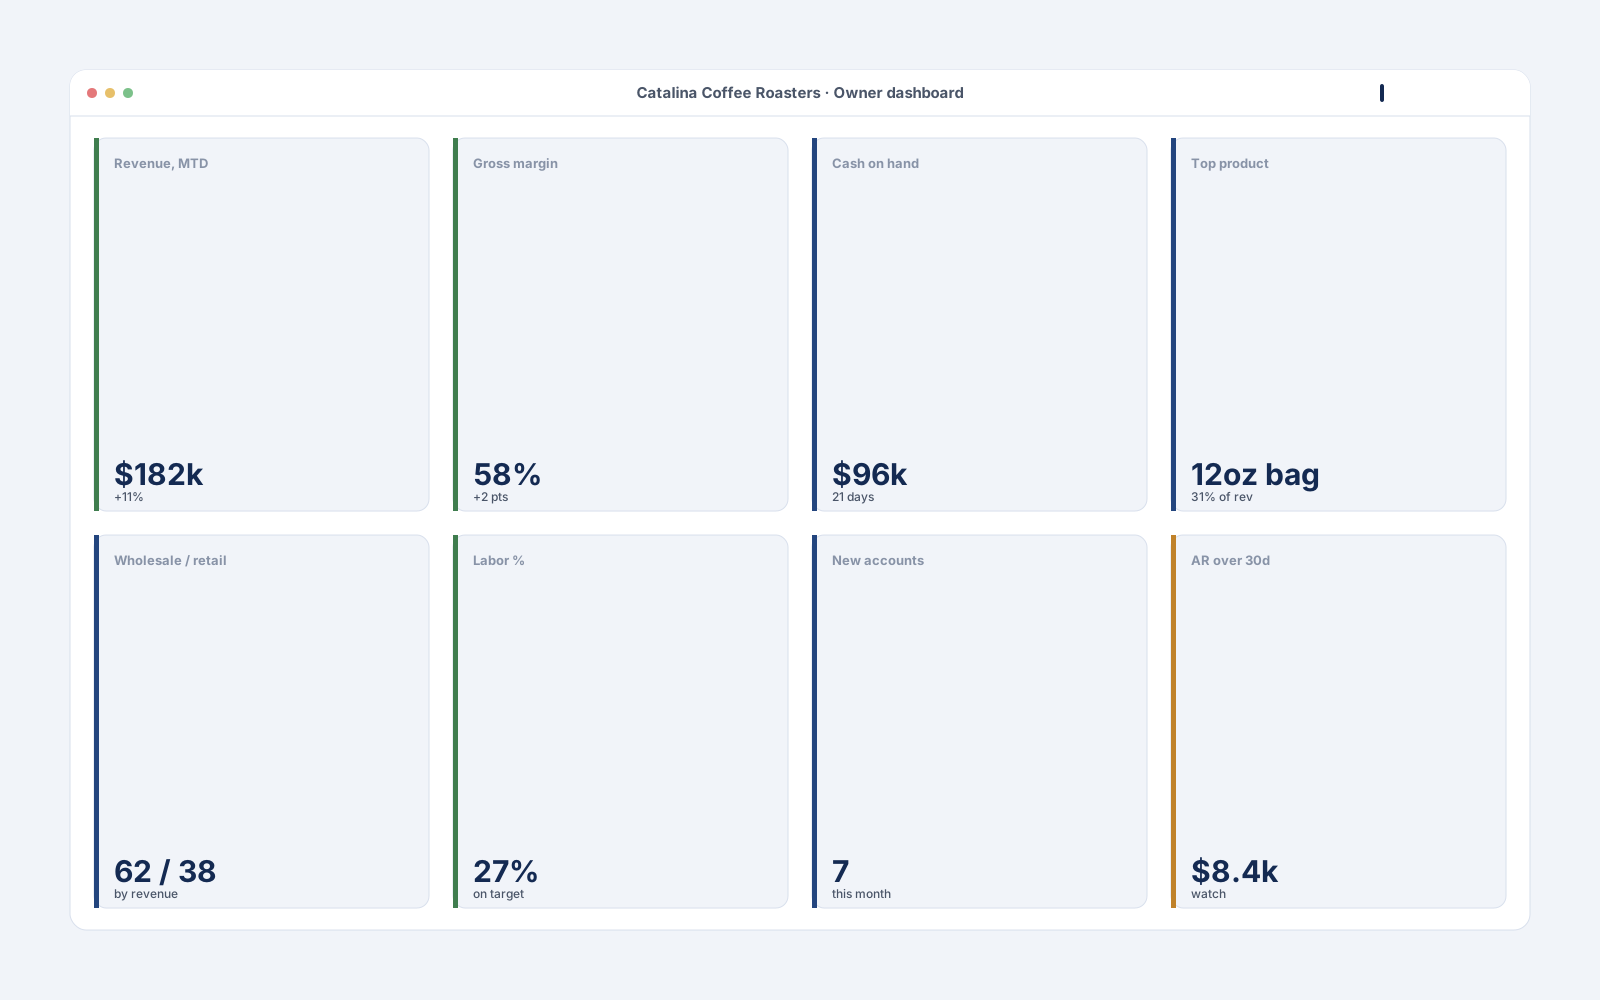
One page, refreshed daily, showing the eight numbers the owner actually wants to see.
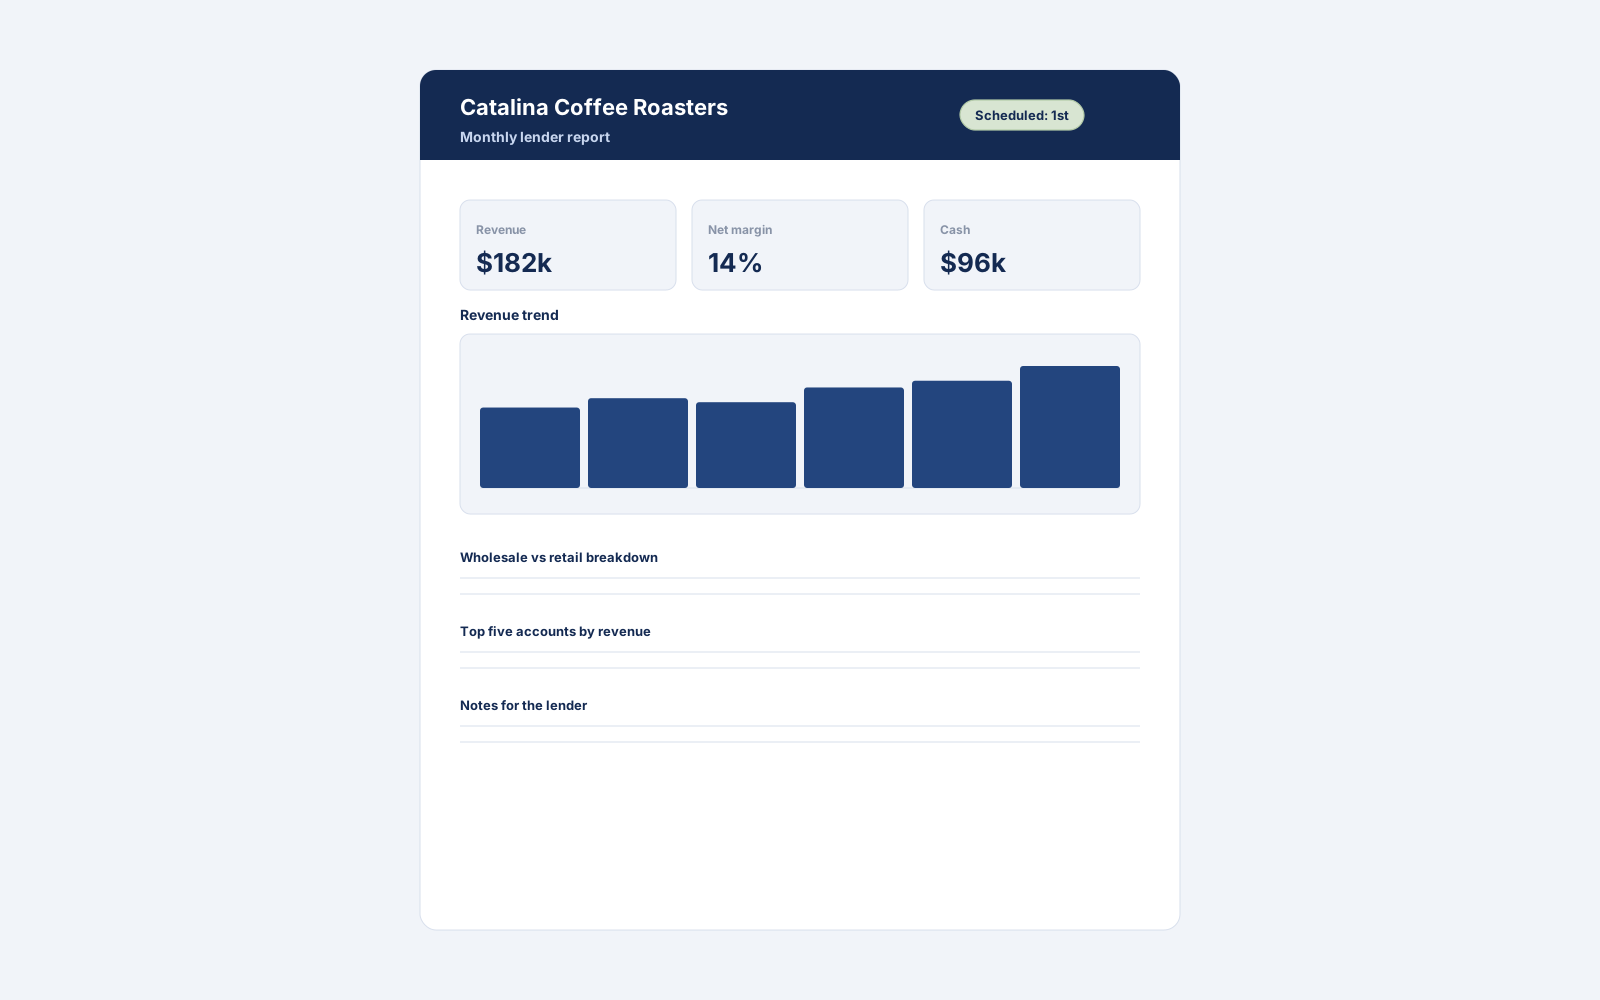
The recurring reports you assemble every month for a board, a lender, a parent company, or a partner, exported on a schedule.
Tier · Look Forward
A real budget you can update yourself, not a static spreadsheet that goes stale in February.
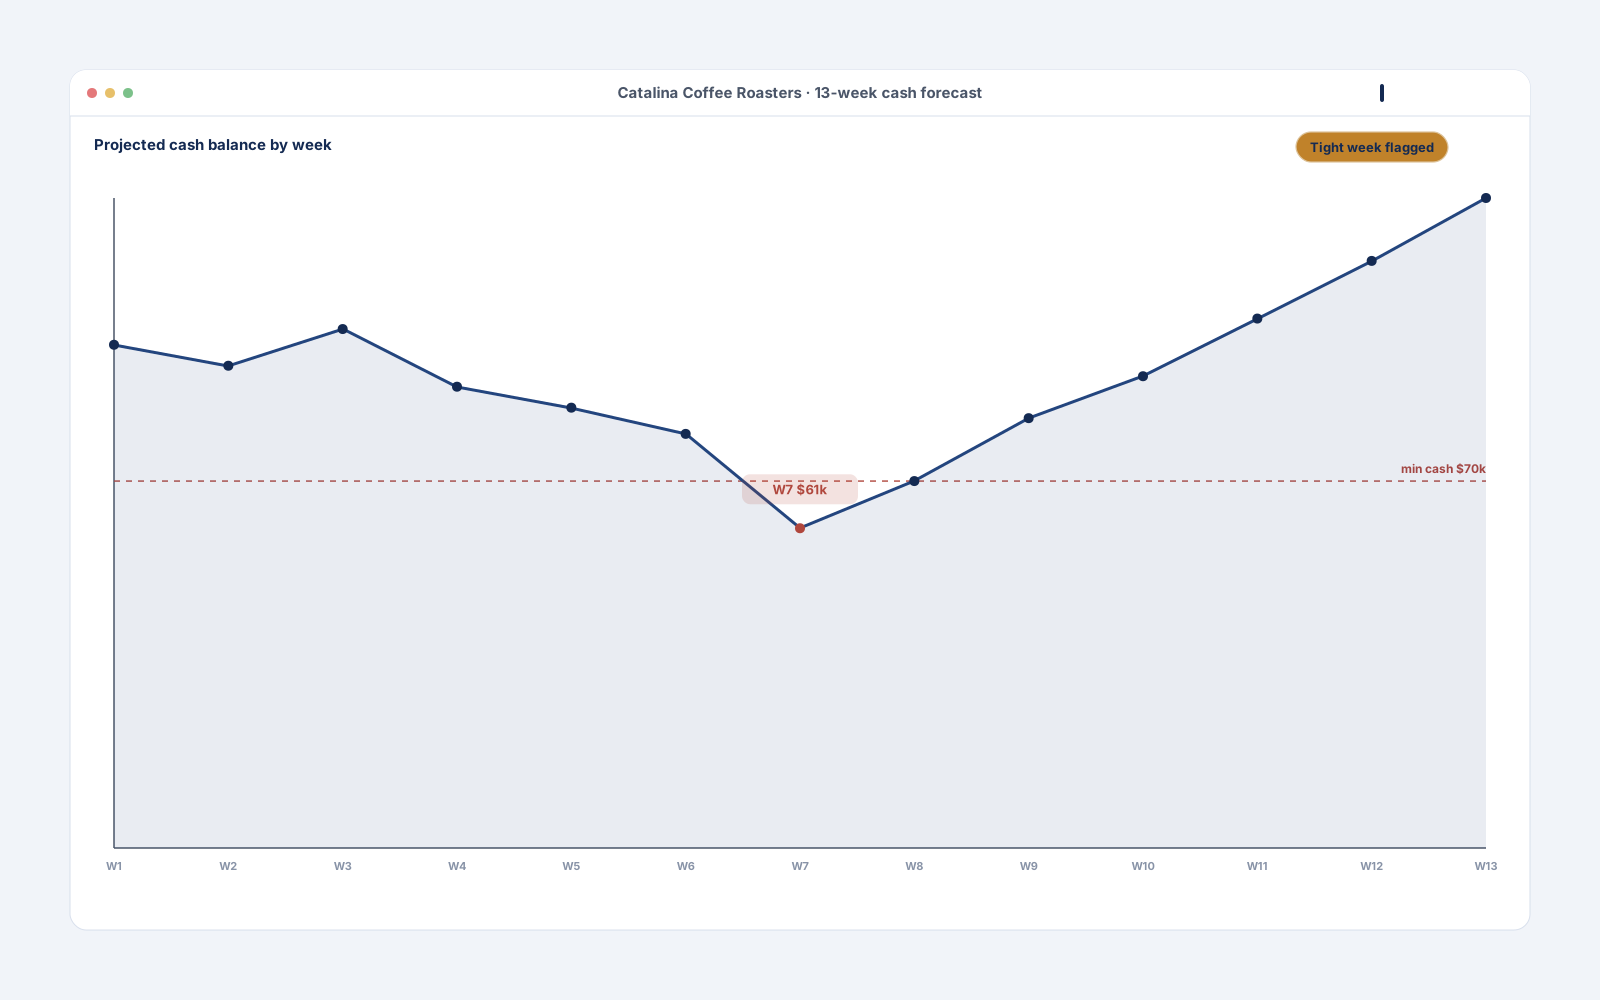
Cash in and cash out, thirteen weeks ahead, so a tight week is a decision and not a surprise.
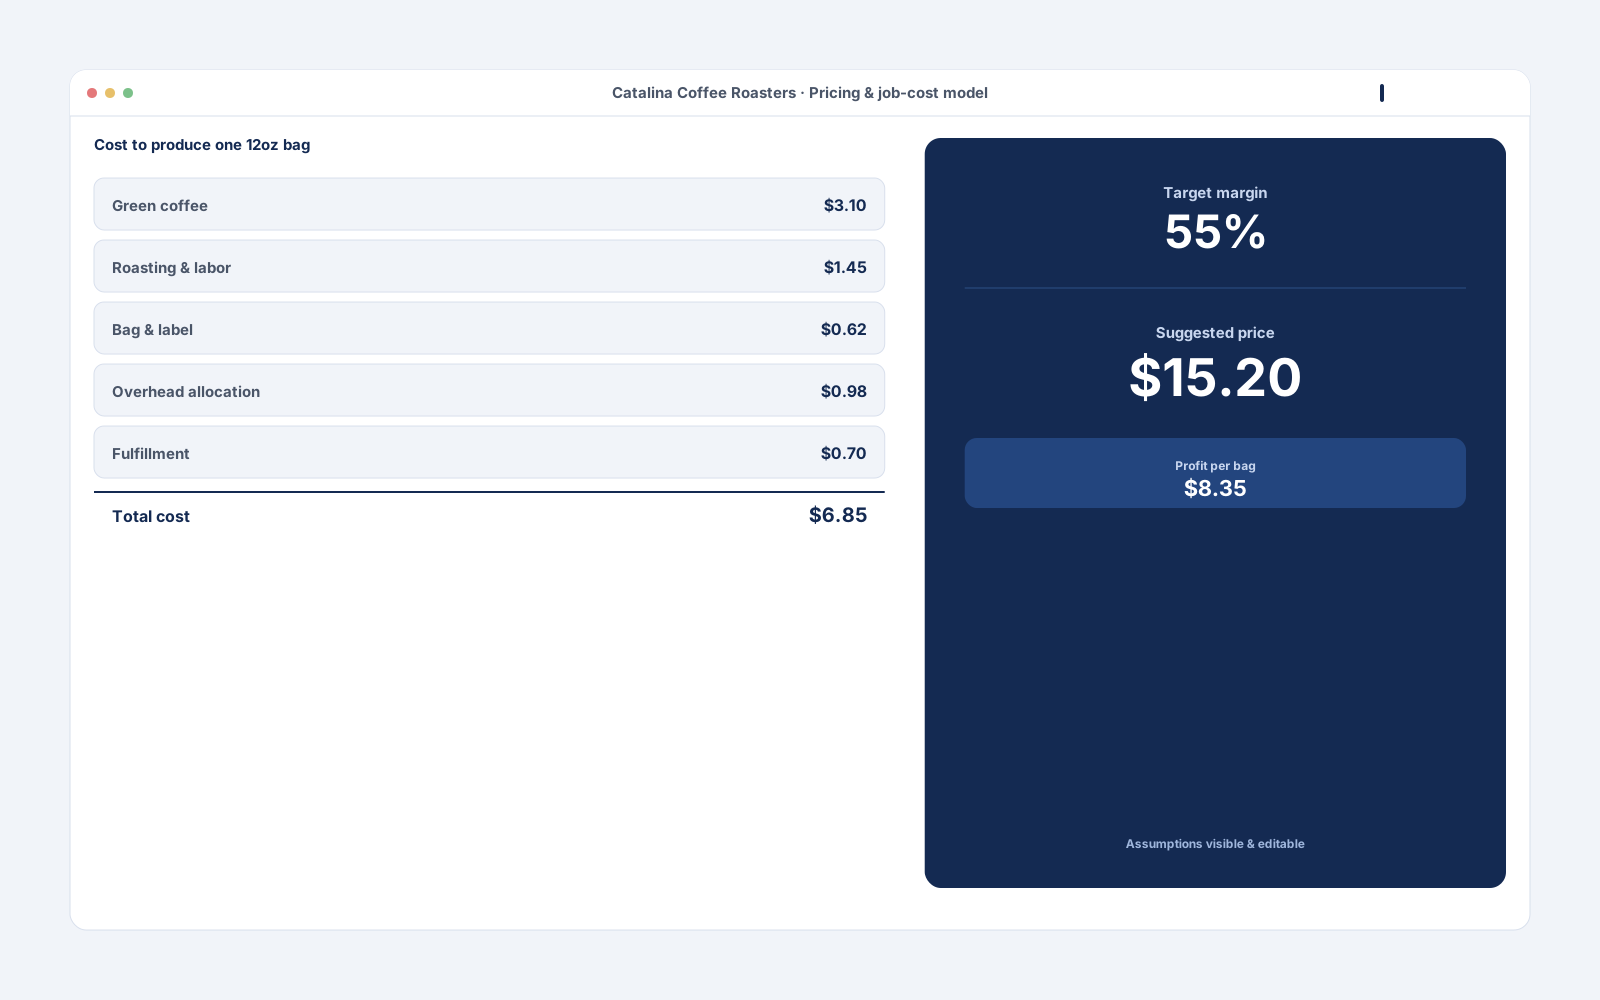
What a job actually costs and what it should be priced at, with the assumptions visible.
Tier · Support
Pull from the tools you already use: Sheets, an accounting export, your CRM, your job board. Scoped to the specific sources in the quote.
Build my toolkit
Start from a preset or build a custom configuration. Foundation containers are always on. Your selection is encoded in the URL so you can copy the page and share it with a partner before sending. When you are ready, drop your name and email and we will come back inside 48 hours with a written, fixed-fee quote.
A guided tour
Mockups shown for a fictional business, Catalina Coffee Roasters. Your install is themed to your brand at no additional cost; see the White-Label Theme container.
Hosting, ownership, and what you pay after handoff
Pricing and timeline
The four anchors. The exact dollar amount lands in the written quote inside 48 hours of the discovery call.
2 to 4 weeks, fixed-fee. Written quote inside 48 hours of the discovery call.
4 to 8 weeks, fixed-fee. Same Pilot Risk-Reversal at the Phase 1 gate.
A single optional line for changes and platform questions, billed only when you use it. Never required, never auto-renewed.
No seat licenses, no platform access fees. The build is yours forever.
Compared to the SaaS stack
Approximate retail SaaS list pricing as of 2026. Your savings depend on your current stack.
| What you commonly pay for | Approx. cost | Container that replaces it |
|---|---|---|
| Dashboard and BI tool, often per data source (Tableau, Power BI Pro, Domo) | $10 to $75 per user per month, plus connectors | Owner Dashboard |
| Board and lender reporting | $50 to $300 per month | Reporting Pack |
| Budgeting and cash-forecast tool (Float, Fathom) | $50 to $200 per month | Working Budget, 13-Week Cash Forecast |
| Pricing and job-cost add-ons | $30 to $150 per month | Pricing and Job-Cost Model |
| Sum | Several hundred per month, recurring | One-time custom build, owned forever |
Costs above are approximate retail SaaS list pricing as of 2026. BI tools often bill per connected data source, so the bill grows as you connect more of your business.
FAQ
No. It reads from your accounting data and turns it into dashboards, reports, budgets, and prices. Your books stay where they are.
From the tools you already use, through the Data Connectors container: Sheets, an accounting export, your CRM, your job board. We scope the exact sources in the quote.
Your choice: your AWS or Azure account, or open-source and self-hosted. You pay your provider directly for usage; we do not resell hosting.
You own the source code, the database, and the documentation. Any competent developer can pick it up.
Yes. The toolkit is modular. A new container slots into the same Foundation baseline and theme.
Yes. They are built for you to edit, and we hand over a recorded walk-through so your team can keep them current.
30-minute discovery call. We come back inside 48 hours with a written, fixed-fee quote and a fixed timeline. If your current stack is the right answer, we will say so on the call.